

DATA Tab
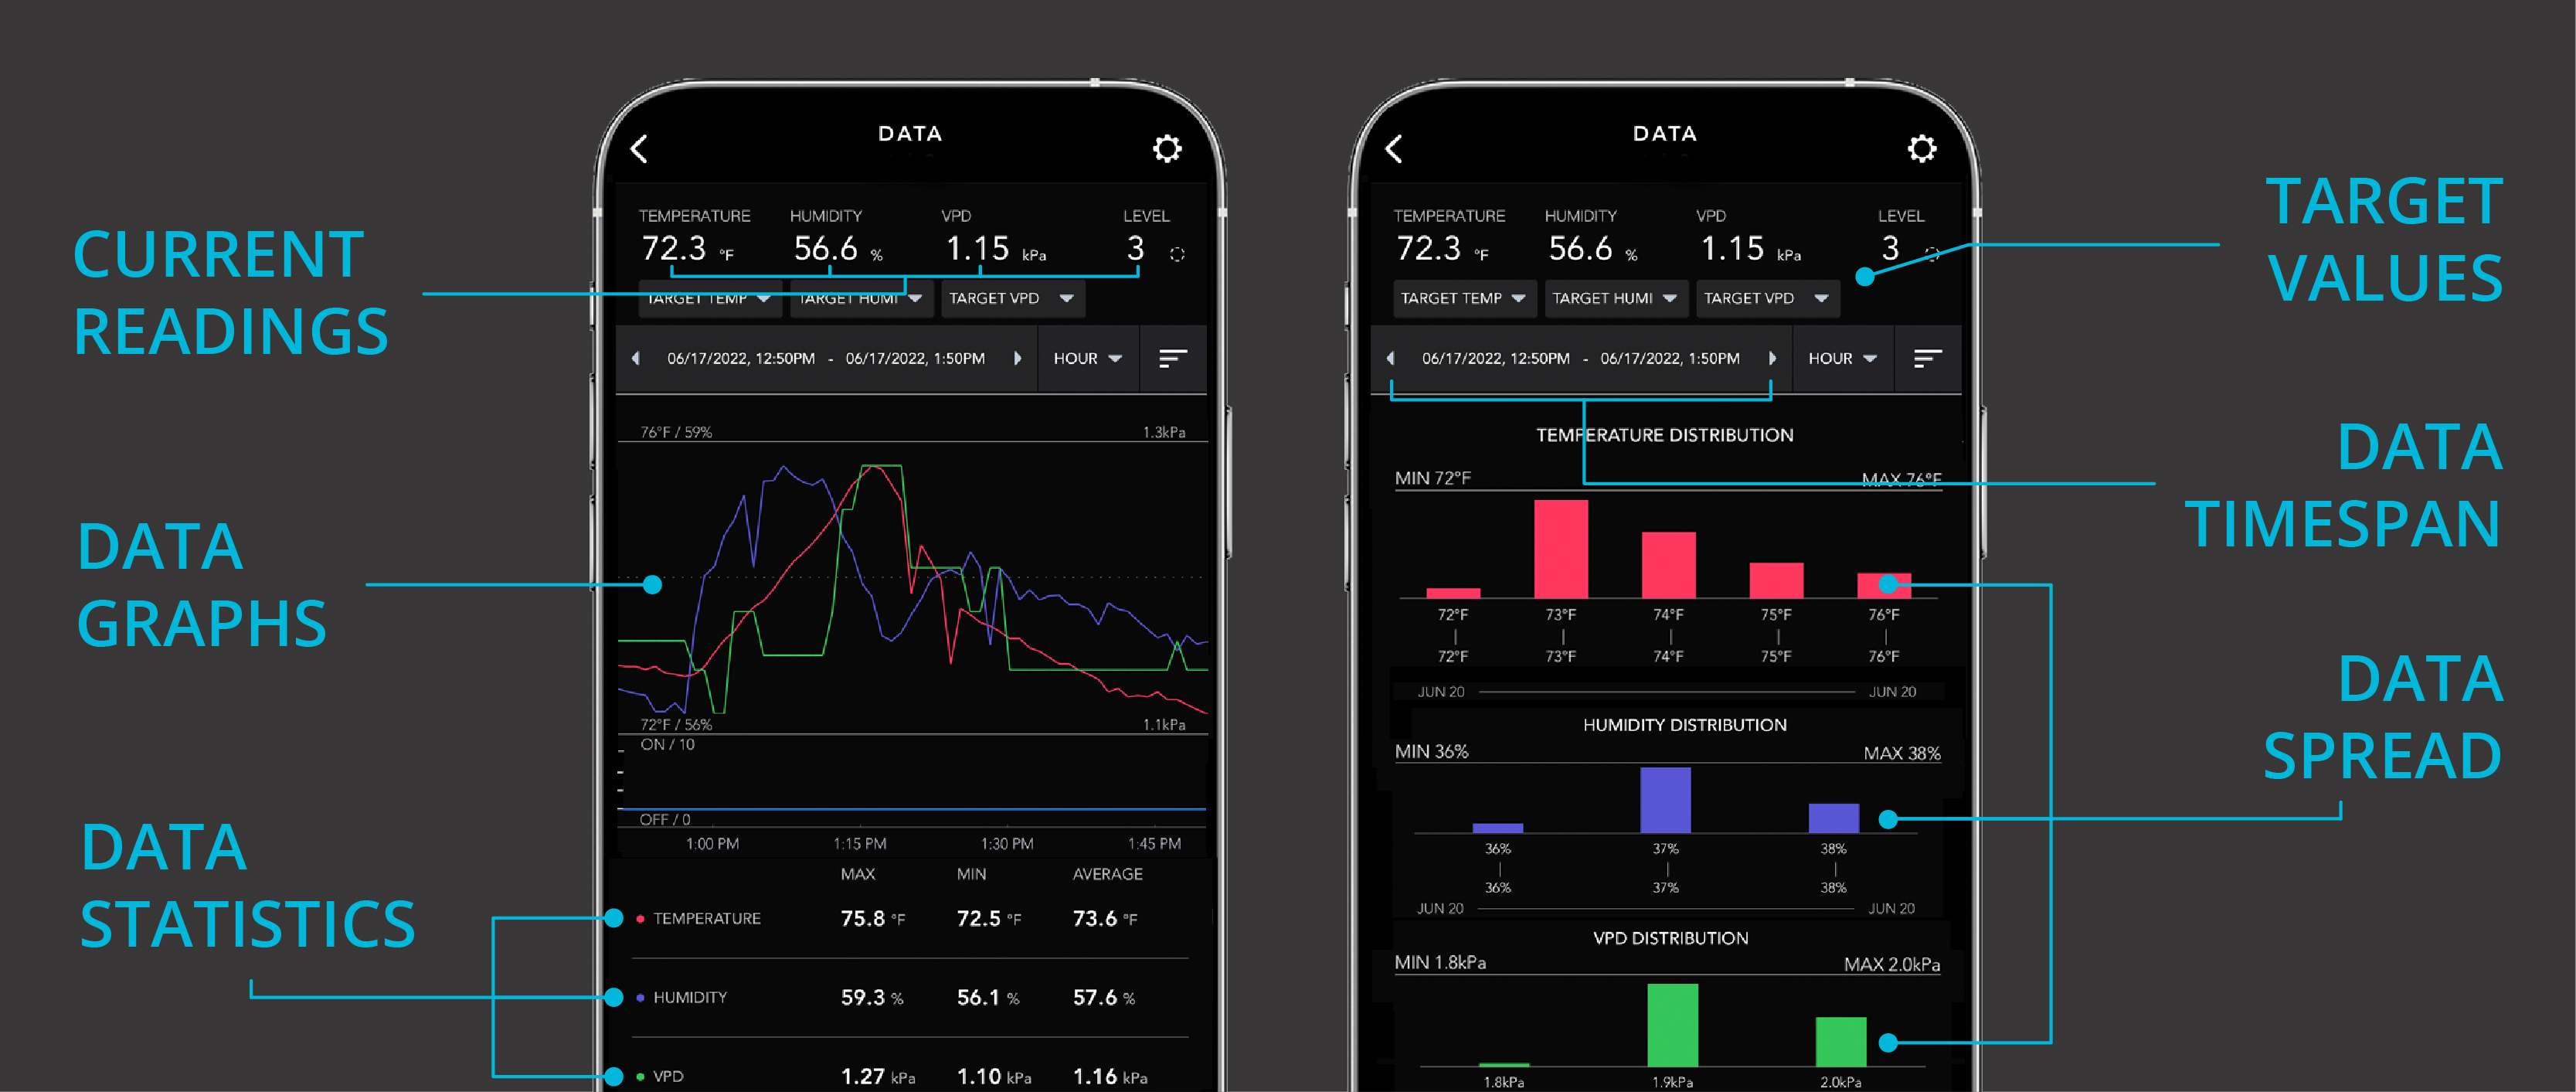
This section stores the quantitative data captured by the controller. At the top of your screen you can select time intervals (hour, day, week, month, or year) to view the distribution of climate data. Temperature and humidity values are shown in trend charts, showing you how the climate in your space changes over time. Temperature and humidity distributions are shown in bar charts, highlighting the most common climate conditions within the selected period. You can export this data as a CSV file to log and track it on your PC.